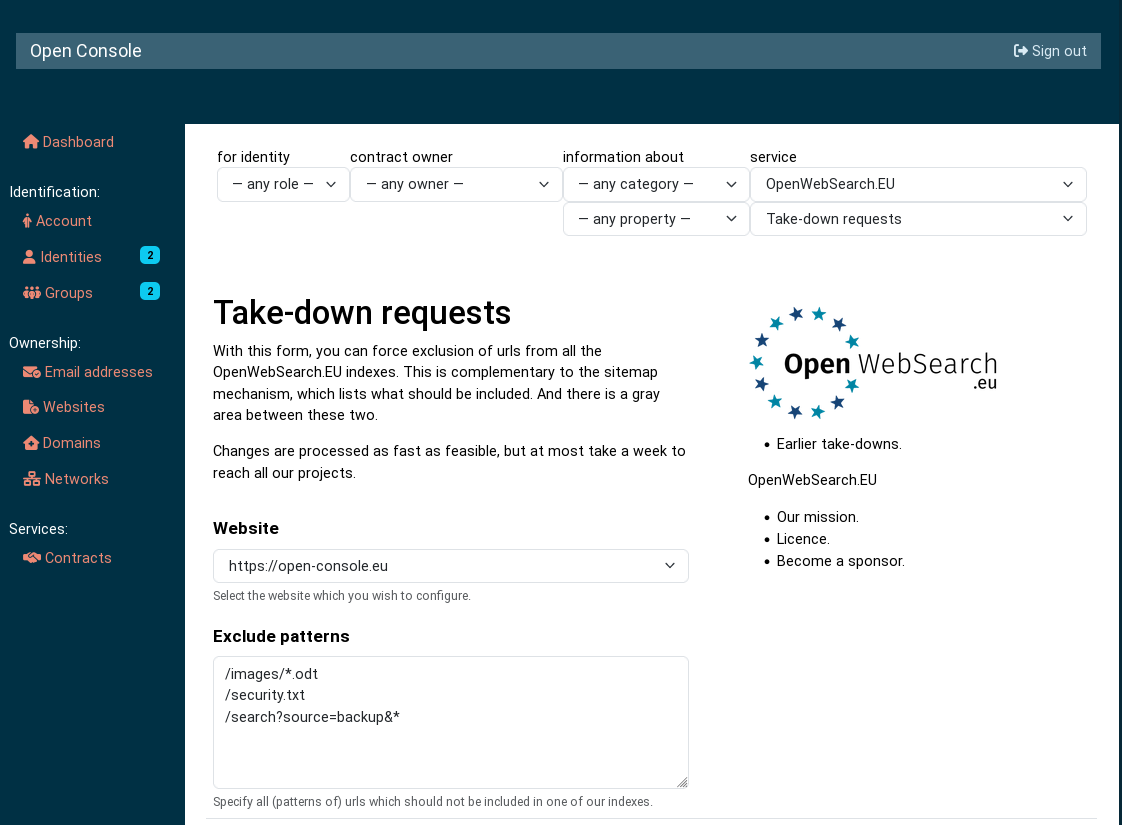
After a successfull sign-in, you will reach the dashboard, the central page of interaction. It provides an overview on your collected configuration, and is an output window towards the services you have configured.
Be aware that the images may look a bit different than actually presented on the real website, due to changes and your personal configuration.
On the left of the screen, you first see configurables which identify you and the groups you take part in.
The counters show how many identities and groups you have configured. When the counter is red, then there are settings which need to be inspected. For instance because there are some changes to be made. These items cannot be used until fixed. Counter values in yellow beg for your attention, without disabling the collectable.
Below the identifying configuration options, you find a list of claims of ownership for facts and assets. When you add email addresses, websites, or other collectables via these menus. You later pass these to services which want (or even require) them to work. These list items will show counters as well.
The bottom group of configurations list the services you are offering and the contracts (the connections) you have signed yourself.
The largest part of the dashboard is used for various purposes. For instance, your configuration forms, system messages, and even direct service output (the services does not need to have its own full website to show you information).
When you click anywhere in the left column, you will see which items have been configured in that category.
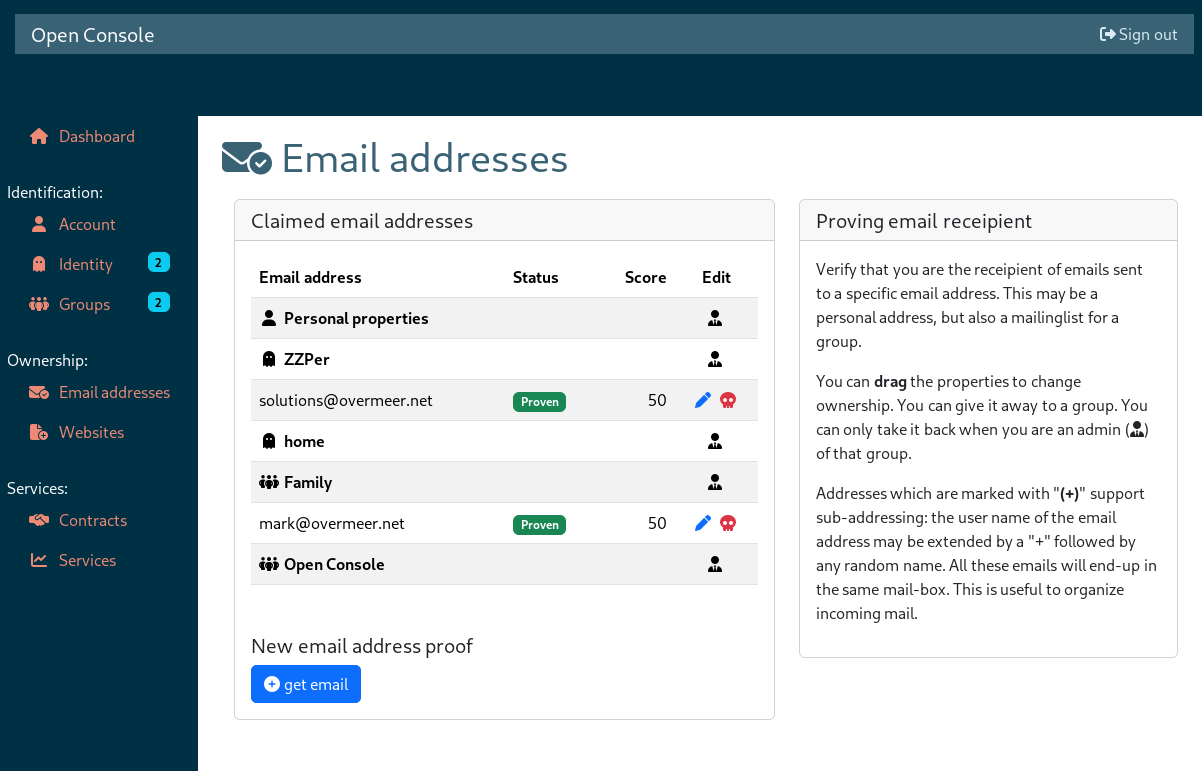
These all follow the same structure: you see your configured account, identities, and groups. Below each, you can have zero or more related collectables (in this example listed email addresses). For these collected items, (pen) means "edit", and (skull) means "delete".
When you are the administrator of a group, and for all items listed with your account and identities, you can drag the items to one of the other lists.
Items can be added without proof or with proof. Often, there are multiple ways to provide a proof. In this example, there is only one algorithm, which apparently involves "get email" (you will get an email with instructions).
Totally uncommon in authorization systems, Open Console assigns a quality score to its proofs. A value of zero (0) means: no proof, just a claim. A value of 100 is given to the best imaginable proof. In this case: other people may capture email towards you on-route, so could theoretically hijack your address, hence only 50 points scored.
When you add a new item (or when you edit an existing item), you get into a complex form in the viewport. This example below shows the creation of a new identity:
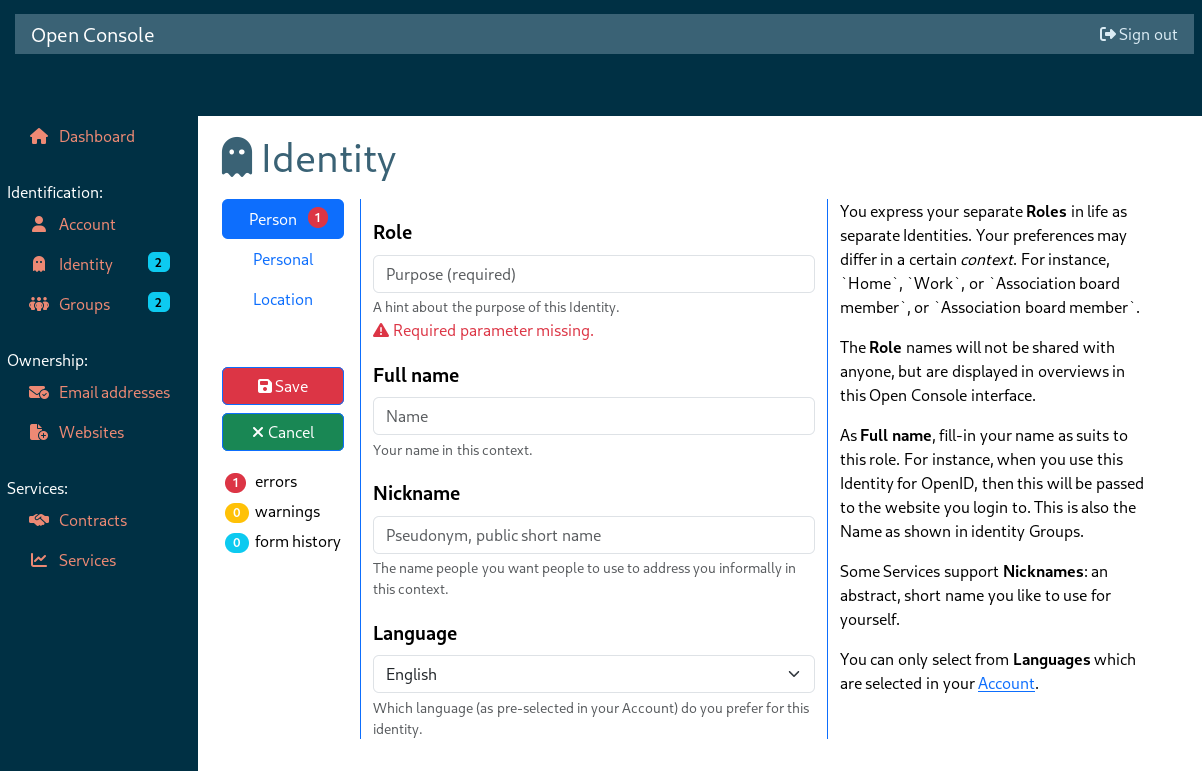
The configuration of an item usually consists of a few pages. Each page is explained separately in the right column. In the left column, you see that this form has three sub-pages (tabs): Person, Personal, and Location.
Behind Person, you see a "1" in a red circle. This means that there is one problem be solved in that form tab. Here you see that the "Role" field is required, but not yet filled in. A summery for all pages is show below "Cancel". Warnings do not need to be solved. The magical term "Form history" refers to changes made to the form since your last "Save" of that form.
The "Save" button will be red when you have made changes to the form, and there are no errors left. Only when you press that button, your changes are stored. Otherwise, they will be lost. Of course, the "Cancel" button will destroy all changes made.